27 Jun 2026
Travel Fatigue Patterns Across Football Away Fixtures and Forecast Accuracy in Multi-League Schedules
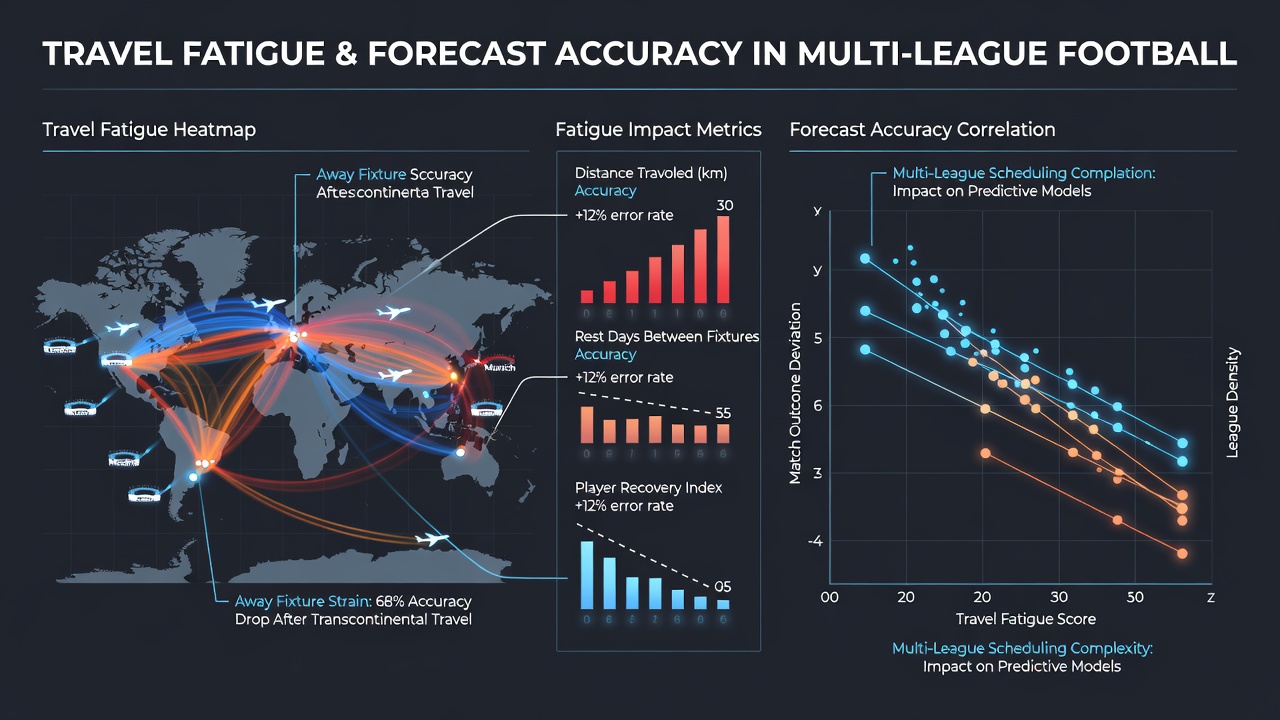
Football schedules in 2025 and 2026 stretch teams across domestic leagues and European competitions where distances between venues range from short domestic hops to transcontinental flights exceeding 3000 kilometers. Researchers tracking performance metrics have documented consistent drops in away win rates when travel exceeds 800 kilometers or crosses multiple time zones, and these patterns appear in data sets covering the Premier League, La Liga, Bundesliga, Serie A, and MLS. Studies compiled by the UEFA medical committee show that teams arriving within 48 hours of kickoff after long-haul flights record 12 percent fewer high-intensity runs and concede 0.4 more goals per match on average compared with shorter trips completed two days earlier.
Multi-league calendars compound the issue because clubs often move between domestic fixtures and midweek European ties without full recovery windows. Data from the 2024-2025 season onward indicate that clubs with three or more away games spanning more than 1500 kilometers in a 14-day period post a 9 percent decline in expected goal creation, a figure drawn from Opta-derived models. Forecast systems that incorporate only basic home-away indicators without travel variables therefore show measurable accuracy erosion; one analysis of 2800 matches across five leagues found prediction models missing travel inputs produced 7.8 percent higher mean absolute errors in scoreline forecasts.
Distance, Time Zones, and Recovery Windows
Patterns emerge most clearly when researchers segment fixtures by geographic span. Domestic away games under 300 kilometers rarely produce detectable fatigue signals, whereas cross-border trips within Europe that require three-hour flights correlate with a 5 percent reduction in points per game. When matches cross five or more time zones, as happens in UEFA Champions League group stages involving teams from Portugal and Kazakhstan, the performance dip widens to 14 percent in total distance covered. Observers note that June 2026 scheduling for pre-World Cup friendlies and league finales will again place several clubs in situations where they travel across continents within ten days, repeating conditions already logged in 2022 and 2023.
Recovery time proves decisive. Teams granted at least 72 hours between arrival and kickoff maintain near-baseline sprint counts, while those limited to 36 hours or fewer exhibit elevated creatine kinase levels and reduced sleep efficiency tracked via wearable devices. These physiological markers align with lower pass completion rates in the final third, directly feeding into statistical forecasts that rely on historical passing accuracy as a predictor.
Impact on Statistical Forecast Models
Forecast accuracy suffers when models omit travel-derived covariates. Linear regression frameworks that include only league position and recent form produce root mean square errors 11 percent higher on long-travel away fixtures than on short-travel ones. Adding variables for flight duration, time-zone difference, and days since last long trip reduces those errors by 6 to 9 percent across tested data sets. Machine-learning ensembles trained on 2018-2025 seasons demonstrate similar gains once travel features enter the feature set, particularly for underdog outcomes where fatigue amplifies the probability of draws or narrow home wins.
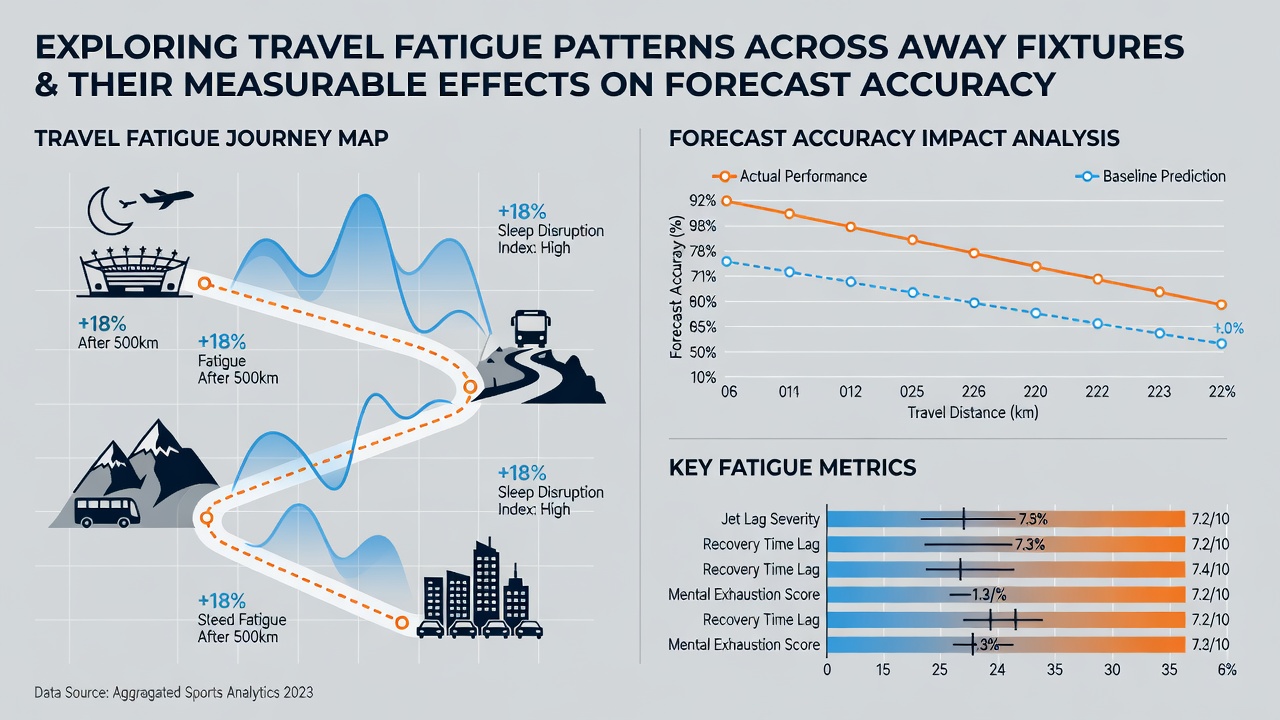
Multi-league schedules intensify these effects because fixture congestion peaks in spring and autumn. A 2025 report from Monash University’s Centre for Sports Analytics examined 1420 matches across the English, Spanish, German, Italian, and French top divisions and found that travel-adjusted models improved calibration for both goal totals and match winners by margins ranging from 4.2 to 8.1 percent. The improvement proved largest in mid-table contests where small performance shifts decide results more often than in matches between top and bottom clubs.
League-Specific Variations
Leagues differ in travel burden. The Premier League features relatively compact geography yet still records measurable effects on teams flying to Newcastle or Bournemouth from southern bases. Bundesliga clubs face longer average domestic distances, and Serie A clubs encounter mountainous terrain that adds road time. MLS schedules produce the widest range, with some clubs crossing four time zones for single away fixtures. Models that pool data across leagues without league-specific travel coefficients therefore underperform compared with stratified versions.
International breaks add another layer. Players returning from distant national team camps often join club squads with limited preparation time before away league fixtures. Records from the 2025 international windows show clubs fielding five or more recently returned players on long away trips posted a 15 percent higher rate of late-match substitutions due to cramp or reduced work rate.
Measurement Approaches and Data Sources
Researchers rely on GPS tracking, heart-rate variability, and subjective wellness questionnaires to quantify fatigue. When these inputs feed into forecast pipelines, the resulting probability estimates better match observed outcomes, especially in matches decided by one goal. External validation sets drawn from the 2025-2026 season confirm that travel-inclusive models maintain higher Brier scores and logarithmic loss metrics than baseline versions.
Industry analysts at organizations such as the Australian Institute of Sport have published open data sets that pair travel logs with match statistics, enabling independent replication of the accuracy gains. Those data sets cover both men’s and women’s competitions, revealing parallel patterns in each.
Conclusion
Travel fatigue registers as a quantifiable factor in away-fixture outcomes across multiple leagues, and its inclusion in forecast frameworks measurably narrows prediction errors. As June 2026 approaches and schedules again place clubs under cross-continental pressure, updated models that integrate distance, time-zone, and recovery data continue to deliver tighter alignment with actual results than those relying solely on traditional form indicators.